
The Corona Shockwave: Coping With Unexpected Events
“Security analysis does not seek to determine exactly what is the intrinsic value of a given security. It needs only to establish either that the value is adequate . . . or else that the value is considerably higher or considerably lower than the market price. For such purposes an indefinite and approximate measure of the intrinsic value may be sufficient.” 1
Benjamin Graham and David L. Dodd
1934
When it comes to financial markets, there’s always a rub, something to worry about. Today’s bugaboo is a biggie: the COVID-19 pandemic. All around the dial, uncertainty reigns.2 Not surprisingly share price gains evaporated as the pandemic spread, with the S&P 500 falling 20% over the course of an extraordinarily volatile first quarter of 2020. And this calendar measurement masks the true depth of the selloff – after rising nearly 5% to its 2/19/2020 high, the S&P fell nearly 34% to its 3/23/2020 low before recovering somewhat through the end of the quarter, and beyond into early April. Other major indices struggled in Q1 as well (DJIA -23.2%, NASDAQ -14.2%).

As with all shocks, hindsight is 20/20. But investing is, and remains, a forward-looking discipline. The big questions now are how “low” is “low” and are tried-and-true tools for evaluating the stock market’s prospects still viable? There’s reason to believe they are.
People who understand risk/reward tradeoffs always try to prepare for the unexpected and tailor their asset allocations accordingly. And even though many were blindsided by COVID-19, it’s highly likely that savvy investors are already sifting through the rubble in search of long-term opportunity. So, how can investors determine when the stock market has returned to fair-value territory?
Fortunately, there’s an objective way to address the problem. For eons, security analysts have relied on the price-to-earnings ratio (“P/E”) when evaluating an individual company’s share price. The ratio is found by dividing a company’s share price by its earnings. A company with $1 per share in earnings whose shares trade for $20, for instance, would carry a P/E of 20x.
A useful perspective emerges when the current P/E ratio is interpreted in the light of its historical norm. Let’s say the hypothetical company’s P/E has historically averaged 18x with two-thirds of the observations falling between 16x and 20x. As a statistical matter, readings within this bracket would be considered normal while those outside the range would be either “undervalued”, if below 16, or “overvalued” if above 20x.
This same approach is applicable to the overall market. By official definition, GDP is the sum of all incomes generated within our borders—the “earnings” of the United States, if you will. Within the US’s GDP, corporate profits account for roughly 60 percent of the figure’s annual fluctuation. Given this dominance, it’s fair to say that the stock market (as proxied by the S&P Composite Index) could represent the price of the economy. By substituting the S&P’s market capitalization (i.e., the share price of its 500 constituents multiplied by each company’s outstanding shares) for “P” and GDP for “E” in the formula, we derive the price-to-economy ratio (“P/Ec”) – an approximate measure of the general market’s value.
Since the turn of the century, the P/Ec ratio’s value has averaged 0.92x with two-thirds of the measurements ranging between 0.74x and 1.10x (Figure 2). In other words, ratios between the red and green bands are common, i.e., “fairly-valued” markets. Valuations above and below these thresholds occur less frequently and might be considered abnormal, occurring just 16% of the time. More specifically, in practice, a P/Ec ratio below the dark blue band signals an undervalued market, while a P/Ec ratio above the orange band signals an overvalued market.3
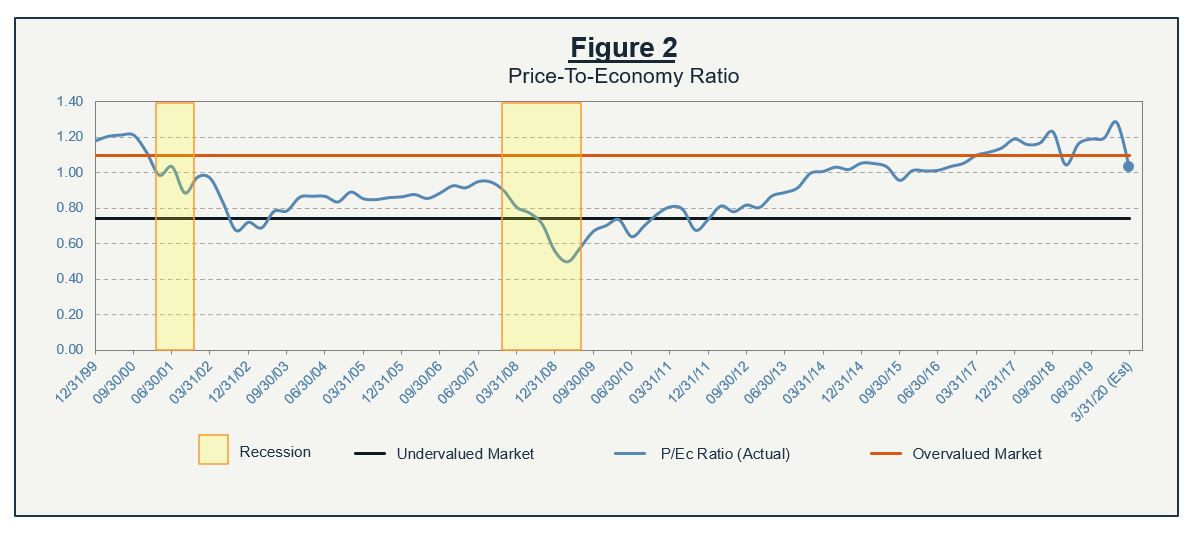
Notice the P/Ec’s behavior leading up to recessions (Figure 2, yellow-shaded areas). In the first instance, it moved into overvalued territory, while in the second it did not (although it had trended upwards for years prior). Now, with a recession likely already underway, the P/Ec ratio is trending downward, already below overvalued territory, at an estimated 1.03x to close the 1st quarter of 2020. Not cheap by any means, but no longer at the overvalued levels it has spent much of the past two-plus years. And while bouts of extreme volatility can throw a monkey wrench in traditional methods of valuation over short periods of time, there is no reason to believe, as some semblance of normalcy returns, these tools won’t continue to provide useful insights into where markets may be headed.
Let’s put the P/Ec ratio’s ability to guide allocations to the test with an academic exercise. Imagine a hypothetical portfolio, we will call it the Tactical Asset Allocation portfolio (TAA), that allocates funds between two assets: 3-month Treasury bills and the S&P 500. Whenever the P/Ec is between the red and green bands, the strategy maintains a 50/50 mix of the two assets.4 When the ratio is above the red line, the entire portfolio is invested in riskless T-bills and when it falls below the green line, it’s fully invested in the S&P. How did it perform? Fairly well.

While there aren’t any guarantees, even this casual simulation reveals important insights. Not only did the TAA exhibit superior returns over the S&P, but scratch a bit deeper and other key differences emerge. As summarized in Figure 3, the TAA also delivered eight fewer negative quarterly returns than the S&P and boasted only two-thirds the volatility. That translates to fewer sleepless nights.
Finally, remember that asset prices are driven by rational expectations. When the stock market encounters an unanticipated event (such as now), expectations change and prices re-equilibrate. If history’s a guide, it’s a safe bet that if investors thought a complete implosion was in the cards, share prices wouldn’t demonstrate any sign of buoyancy. Yet that’s what happened in late March into April. Granted, sentiment may have swung too far toward optimism in recent days on the heels of not-as-bad-as-expected virus news at the end of last week coupled with unprecedented fiscal and monetary stimulus.
To be sure, no investor is right 100% of the time. It comes with the territory. But the important point is that market participants try, desperately, to “get it right.” After all, their wallets are on the line. And though their ability to foresee events is necessarily limited, careful examination of the empirical record confirms that maintaining a diversified and valuation-based approach to portfolio management even through difficult times, with a time-tested process, provides investors with solid long-term results.
![]()
___________________________________________________________________________________________________________
1 Benjamin Graham and David L. Dodd, Security Analysis, McGraw Hill Book Company (1934), p. 18.
2 See: Insights, “COVID-19 and Market Volatility” at www.bostonrm.com.
3 For a detailed discussion of the P/Ec ratio, see Charles E. Babin and William J. Donovan, “Investing Secrets of the Masters,” McGraw Hill (1999), p 116.
4 In practice, the allocation mix may be tailored to suit an individual’s investment objectives and risk tolerance.