

Exuberance Revisited
Nothing so undermines your financial judgment as the sight of your neighbor getting rich.
John Pierpont Morgan Sr.
In many ways, the second quarter of 2026 was a remarkable (and often bewildering) one for stocks, with the S&P 500 gaining 15.2%, the Nasdaq 21.6%, and the Dow 13.4%. For the S&P, it was the index’s best quarter since Q2 2020, which had been preceded by a particularly brutal pandemic-induced decline of 20% in the first quarter of that year. Stripping that out, the last three months were the S&P’s best since mid-2009 (which also followed a sharp drop amid the Great Financial Crisis). 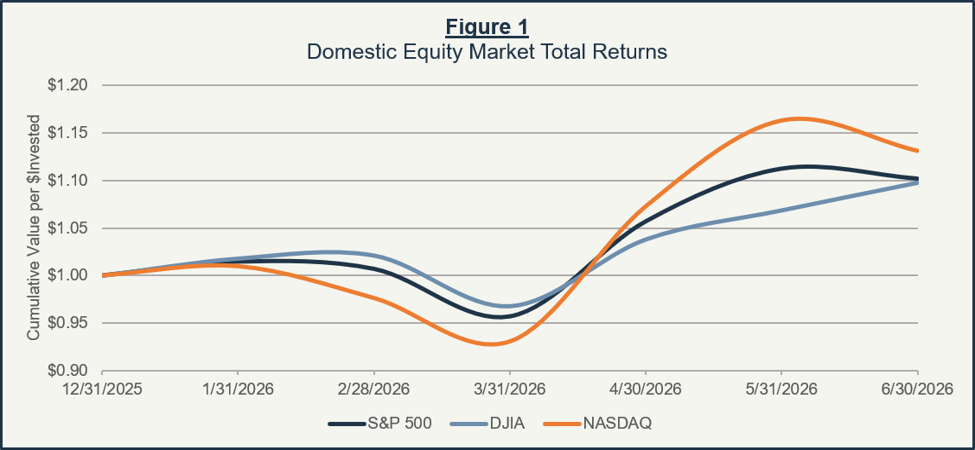
Yet gains were not broad-based, and if you feel like you might have missed something, you are far from alone. Once again, it was the technology sector that led the way, gaining some 32%—more than twice the next best-performing sector (industrials at +15%)—and marking the third year in a row that tech dominated second-quarter returns. Predictably, concentration within equity markets also remains near all-time highs, with the S&P 500’s top 10 components accounting for 38% of the total index—hardly the epitome of a diversified portfolio. What’s more, 5 out of the 10 fall within the tech sector, and all but drugmaker Eli Lilly (LLY) are considered to be “AI stocks.”1
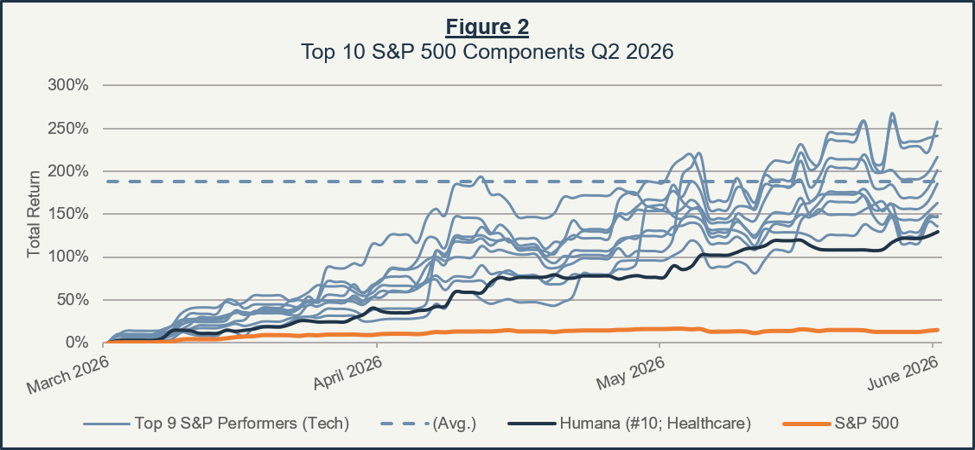
What actually drove the S&P’s performance is more revealing still. Of the index’s best-performing components in the second quarter, 9 out of the top 10 were tech names. As a group, they climbed an average of 188% in a single quarter.
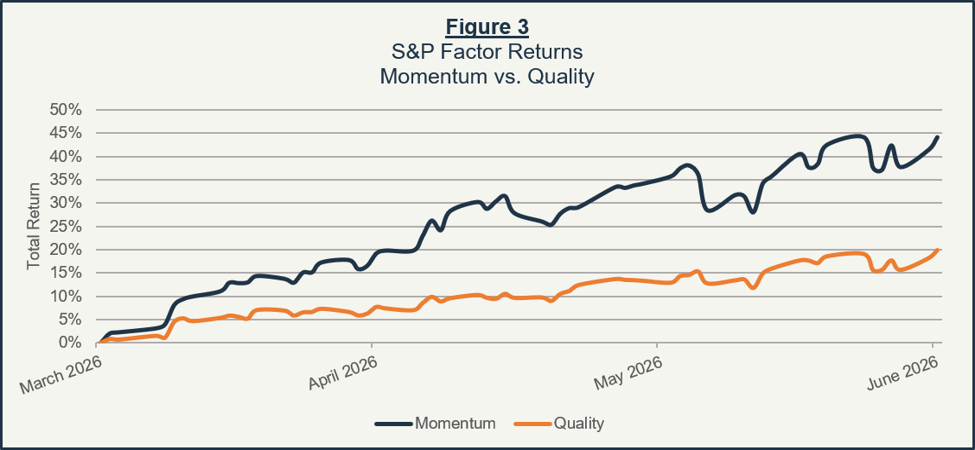
Break the returns down by factor, and the picture is unmistakably trend-driven, with the “momentum factor”—a measure of the tendency of stocks to keep performing well over the near future simply because they have performed well over the recent past—returning roughly 44%, more than double that of the “quality factor”—a measure of companies with consistent profitability, strong balance sheets, and other favorable fundamental characteristics.
Zooming further out, an even more surprising dynamic has been unfolding across the Russell 3000, which tracks roughly 97% of the investable US equity market. Over the past nine months, companies with negative earnings (i.e., those that are not profitable) have begun to outperform companies with positive earnings.
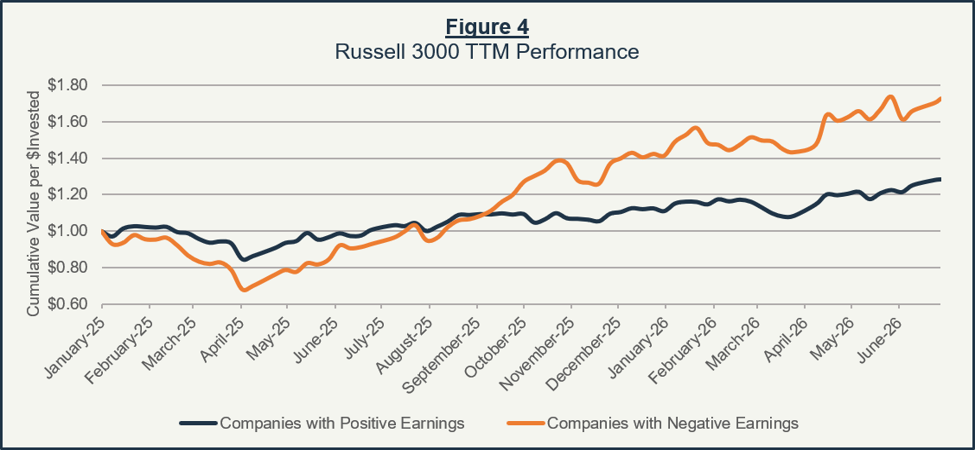
This phenomenon has only occurred three other times since 2000: during the post-Covid rebound of mid-2020 to early 2021, the 2009 rally immediately coming out of the Great Financial Crisis, and amid the early 2000s dot-com bubble. All three were eventually followed by major reversions that saw profitable companies retake the lead.
While tempting to chase returns, history has shown that may be precisely the wrong instinct at this stage of the cycle. This past quarter was, by almost any measure, an unusual one—remarkable not only for the size of the market’s gains but for their composition. A rally of this nature, carried by a select theme (“AI”) and frequently propelled by speculation rather than fundamentals, is not characteristic of a durable trend. Often the most difficult part of investing comes in moments like this, when the perception of prosperity comes at the expense of discipline. Remember, though, the investments that reward patience are seldom the ones that feel most obvious to chase.

_________________________________________________________________________________________
1 The rest of the top 10 are Nvidia (NVDA), Apple (AAPL), Microsoft (MSFT), Amazon (AMZN), Alphabet (GOOGL/GOOG), Broadcom (AVGO), Meta (META), Tesla (TSLA), and Micron (MU).