
The 2019 Economic Outlook
"High prices and low prices are not marked with distinguishing signals, like red and green traffic lights. Not only are ‘high’ and ‘low’ always relative terms, but on Wall Street their meaning is mainly retrospective.”
Benjamin Graham and David L. Dodd
1934
On the heels of a topsy-turvy first-half, the equity market caught its second wind. Across the board, all of the general indexes closed out the third quarter in (or around) new highs and sporting robust year-to-date performances (S&P 9%; DJIA 7%; NASDAQ 17%). Ironically, prosperity has Wall Streeters on edge, wondering if the 10-year bull market has life in it yet. After all, nobody wants to get caught holding the bag should the economy peter out.
Figure 1: Domestic Equity Markets

With perfect foresight, of course, every equity investor would simply target riskless assets in advance of a downturn knowing they could reverse the trade in advance of a recovery. But omniscience isn’t part of the human condition. So absent a crystal ball, how can investors develop a “feel” for the economic outlook? Here’s where regression analysis and statistical inference come into play.1
Figure 2: The Post-Recession Bull Market
As the preeminent Yale economist Irving Fisher observed a century ago, the rate of interest permeates all economic relations -- the sum of which is Gross Domestic Product ("GDP") – and offers a plausible explanation for the linkage between credit and equity markets.2 If the theory has merit, then interest rates ought to tell us something about GDP and, in turn, equity markets. And empirical evidence confirms that interest rate fluctuations provide useful insights.3 True, market participants aren’t always correct. But it’s a safe bet they try. After all, unlike pundits, they back up opinions with cash.
Figure 3 traces the methodology’s enviable forecasting record. Keep in mind that GDP growth has averaged 3.0% historically.4 Outcomes above this threshold are considered robust, and those below anemic. Now focus on the recessionary periods (blue bands). In every instance the model anticipated a slowdown. Focus on the biggest meltdown, the Great Recession of 2008-9.5 How did the model perform? Well.
Figure 3: Implicit Market Forecasts: The Historical Track Record

As with any statistical measurement, there’s a cone of uncertainty.Thankfully, estimation of the upcoming year’s outlook doesn’t require precision. A ballpark figure will suffice. And knowledge of the model's error allows us to cast probability estimates for various scenarios (Figure 4).
Figure 4: The 2019 GDP Outlook In Perspective

While it’s a tad early for 2019 forecasts, at this juncture the possibility of a full-blown recession is remote. There are significant odds that next year’s GDP will be positive (94.5%). But that said, there’s only a 28.5% chance it will prove super-normal.
Figure 5: The 2019 GDP Outlook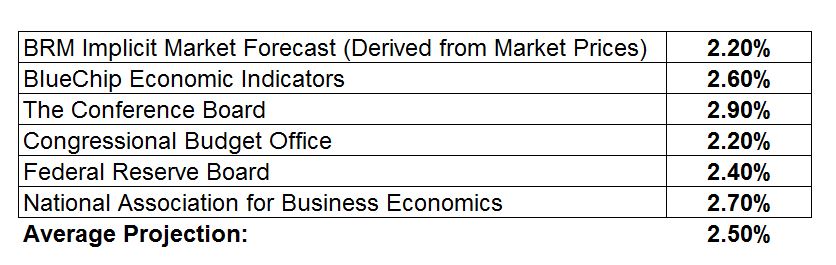
The bottom line? Expect next year’s economy to limp along at around 2.5% -- down a tad from this year’s likely outcome (2.9%). Still, equity risk continues to be warranted, especially for high quality dividend growers. If history’s a guide, it will pay to capitalize on any downside volatility. ![]()
1 When it comes to divining variables of importance to financial markets, it is often helpful to start by examining the past. As one investment bible put it: "The soundness of a security purchase is determined by developments and not by past history or statistics. But the future cannot be analyzed; we can seek only to anticipate it intelligently and prepare for it prudently." (See Benjamin Graham and David L. Dodd, Security Analysis, McGraw-Hill Book Company, 1951, p. 3.
2 Irving Fisher, The Rate Of Interest, The MacMillan Company, 1907, p. 336.
3 As a statistical matter, the lion's share (55%) of the year-over-year change in GDP is explained by interest rate fluctuations over the last half century.
4 Measured over the 1963-2017 interval.
5 Peak-to-trough, real GDP declined some 4.3%.